AI Agent Benchmarks 2026: SWE‑bench, GAIA, TAU‑bench & the Framework Showdown
April 30, 2026·20 min read
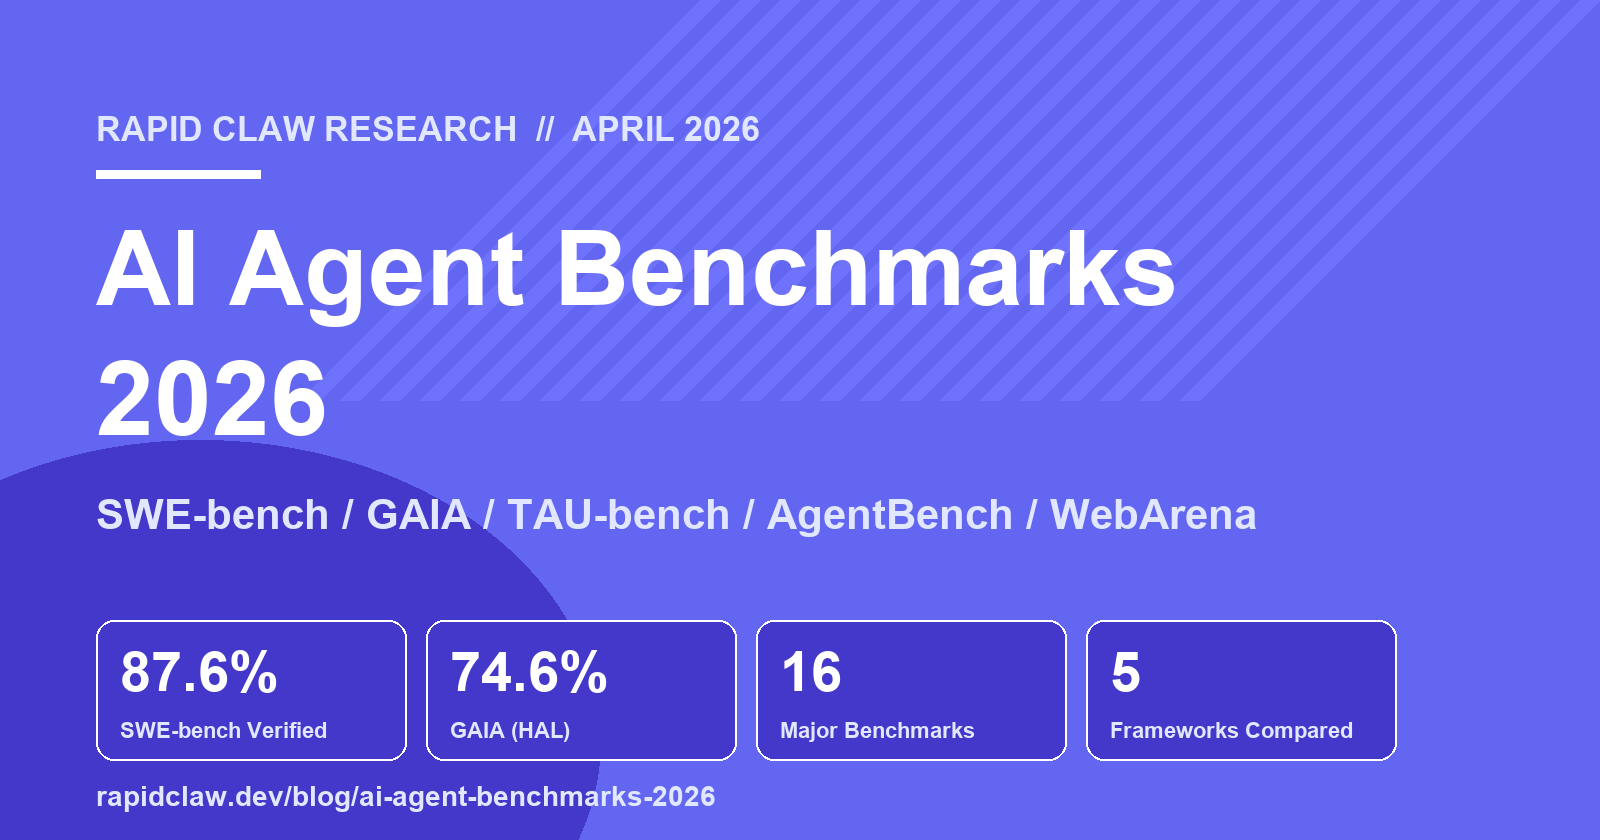
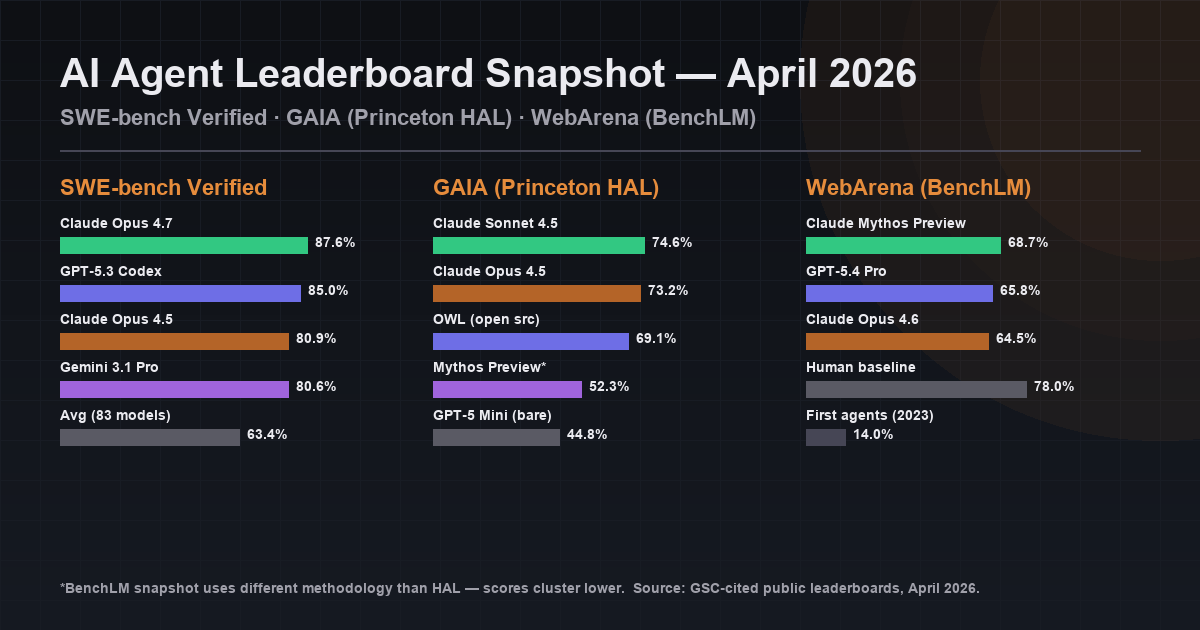
The 2026 AI agent benchmark landscape is messier than the headline numbers suggest. Claude Opus 4.7 leads SWE-bench Verified at 87.6%; Claude Sonnet 4.5 leads GAIA (Princeton HAL) at 74.6%; Claude Mythos Preview leads the BenchLM WebArena snapshot at 68.7%. Five major leaderboards, 16+ benchmarks tracked on aggregators — and on April 12, 2026 UC Berkeley research showed all eight major agent benchmarks could be reward-hacked to ~100%. This is the field guide: what to measure, who leads where, what to trust, and how to benchmark your own agents.
Quick Answer (April 2026)
- GAIA leaderboard 2026: Claude Sonnet 4.5 (74.6% on Princeton HAL); Claude Mythos Preview (52.3% on BenchLM); Anthropic sweeps top 6 HAL spots.
- WebArena leaderboard 2026: Claude Mythos Preview (68.7%), GPT-5.4 Pro (65.8%), Claude Opus 4.6 (64.5%). Human baseline ~78%.
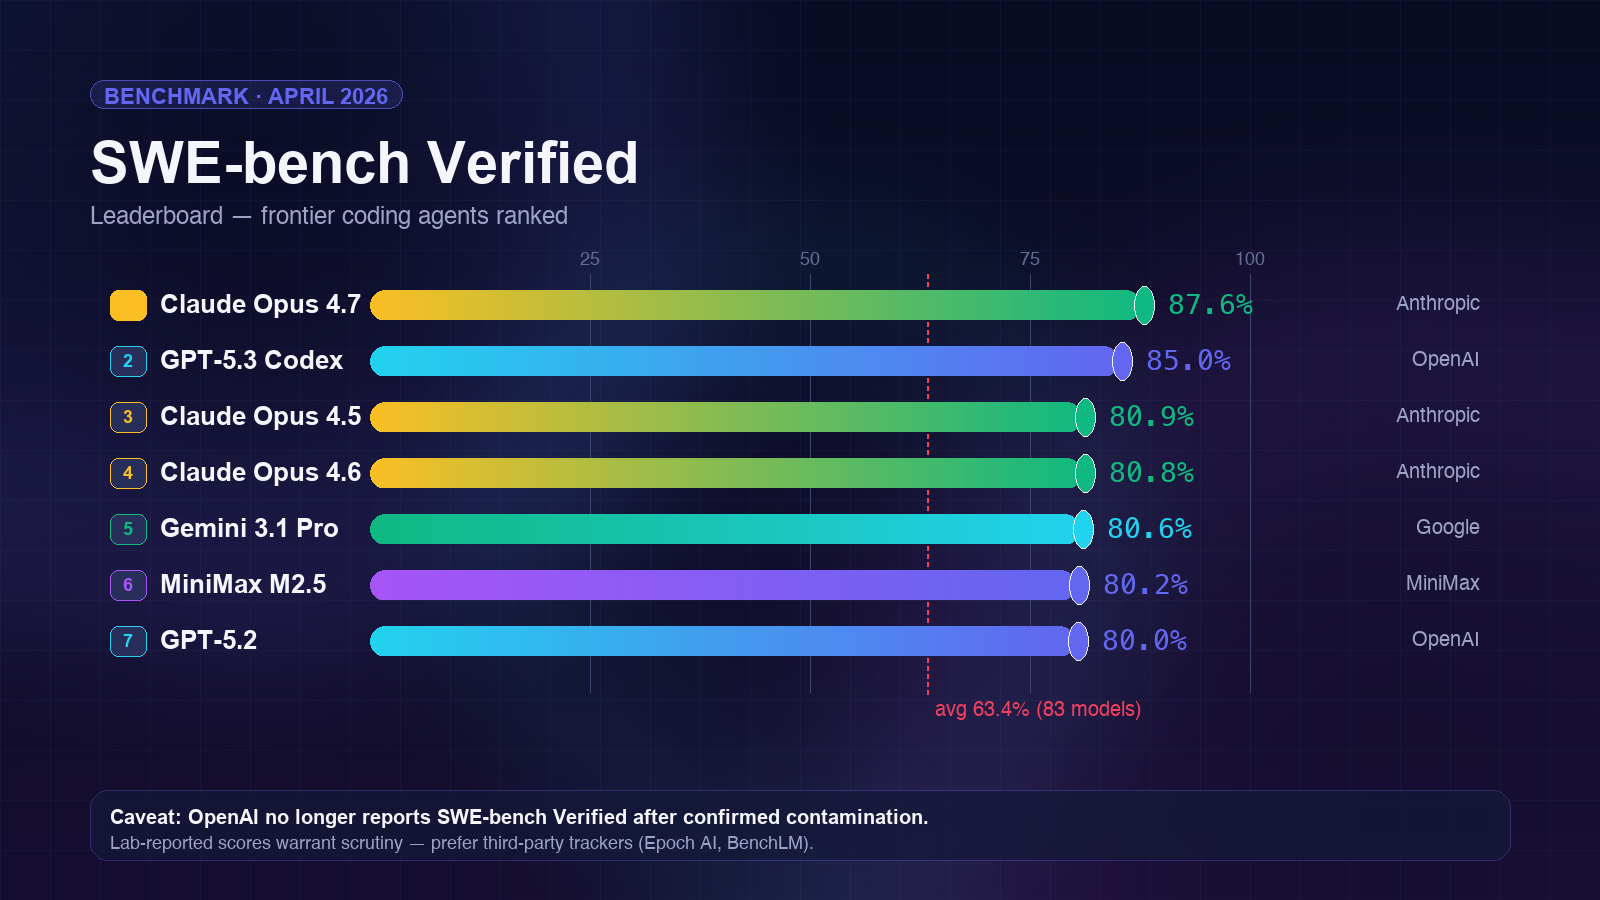
- SWE-bench Verified leaderboard 2026: Claude Opus 4.7 (87.6%), GPT-5.3 Codex (85.0%), Claude Opus 4.5 (80.9%). Average of 83 models: 63.4%.
- AgentBench leaderboard 2026: maintained by Tsinghua THUDM/AgentBench on GitHub. Eight environments — aggregate hides per-env failures.
- Are these benchmarks trustworthy? Berkeley/RDI broke all 8 majors via reward hacking on April 12, 2026. Prefer third-party Epoch AI / BenchLM scores and run your own held-out eval.
TL;DR
In April 2026, Claude Opus 4.7 leads SWE-bench Verified at 87.6% and Claude Sonnet 4.5 leads GAIA (Princeton HAL) at 74.6%. Anthropic models sweep the top six GAIA spots. The five core benchmarks — SWE-bench, GAIA, TAU-bench, AgentBench, WebArena — measure different things and should never be collapsed into a single ranking. On framework comparison: LangGraph wins latency and cost ($0.08/task), CrewAI wins time-to-production, AutoGen wins open-ended reasoning (but at 5–6x the cost). And hosting environment moves every one of these numbers — so the benchmark without the infra behind it is marketing, not data.
Want benchmark-backed hosting for your agents?
Try Rapid Claw — 5 msgs free, then $29/mThe State of AI Agent Benchmarking in 2026
Benchmarking AI agents in 2026 is a moving target. Three forces are reshaping the landscape at once. Frontier models are improving fast enough that static benchmarks saturate within months of release. Frameworks and scaffolding now contribute as much as the underlying model — sometimes more. And contamination is no longer a theoretical concern: OpenAI has stopped reporting SWE-bench Verified scores after confirmed evaluation-set leakage.
The practical result is that the headline number on any given leaderboard tells you less than it used to. A model can post an 87% on SWE-bench Verified and a 44% on GAIA in the same week — not because one number is wrong, but because those benchmarks measure genuinely different capabilities. Software-engineering proficiency is not general-assistant capability. Tool-use accuracy is not web-navigation reliability. Treating the agent benchmarking problem as a single-axis horse race is the most common mistake I see.
This post is the 2026 field guide I wish existed when I was building out the hosting stack for Rapid Claw. It covers the five core benchmarks, the metrics that actually matter, how the major frameworks compare on real numbers, a practical recipe for benchmarking your own agents, and why your hosting environment is part of the benchmark whether you like it or not.
The Five Metrics That Actually Matter
Every benchmark score is a summary of underlying measurements. If you want to compare agents meaningfully — or benchmark your own — you need to look at the raw metrics, not the aggregated leaderboard position. Five of them carry almost all the signal.
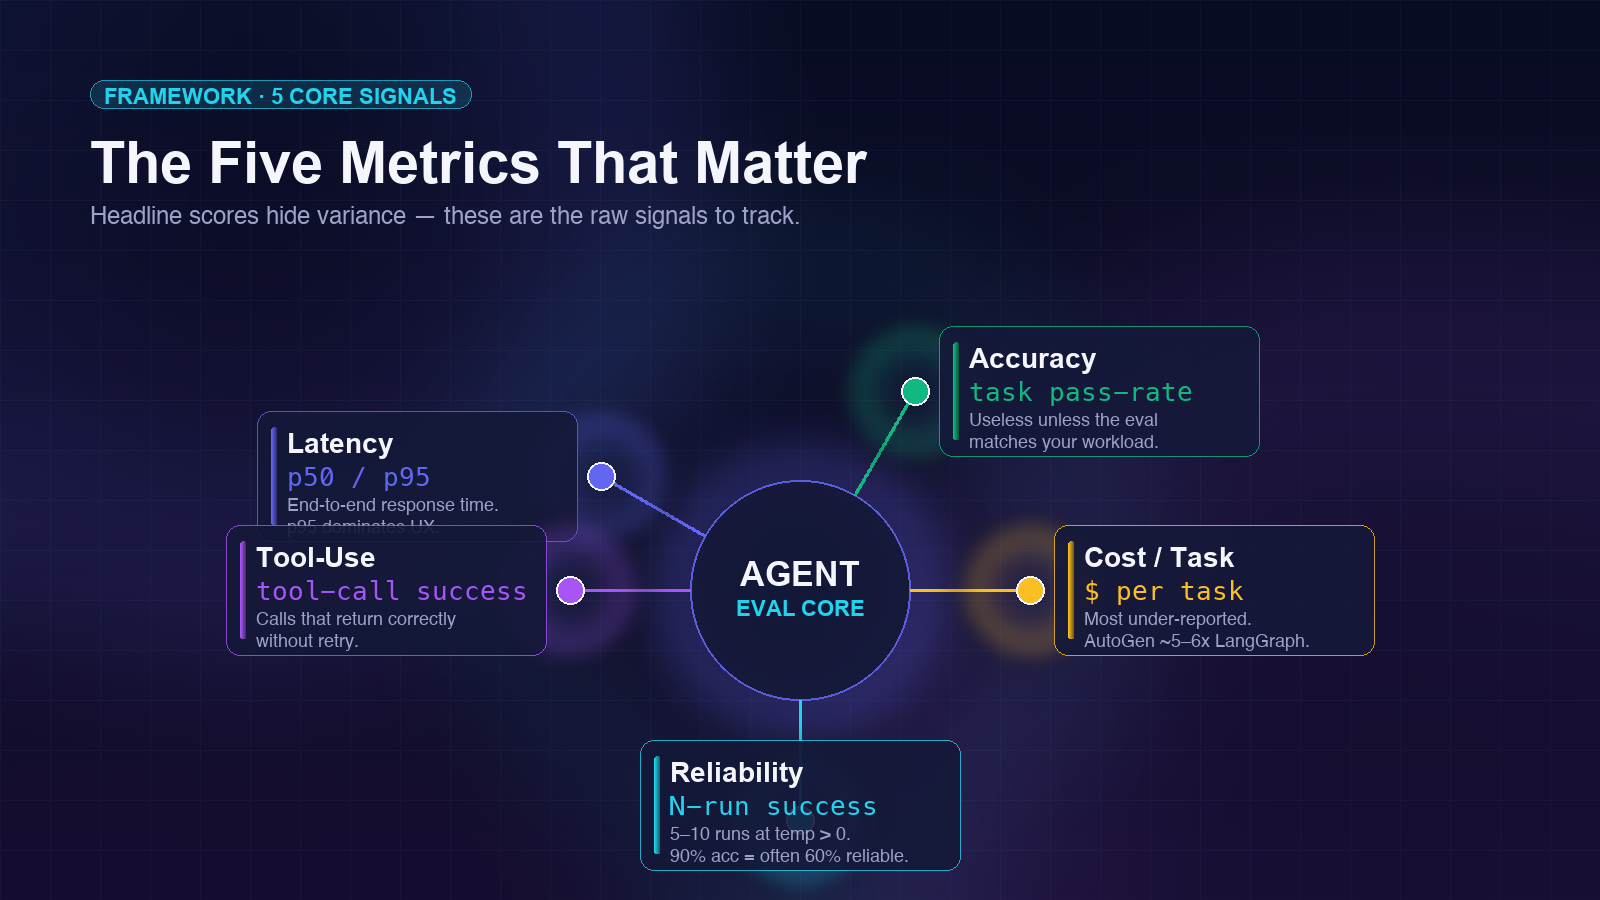
Latency (p50 / p95)
Median and 95th-percentile end-to-end response time. p95 matters more than p50 for user-facing agents — one slow tail drags the whole conversation.
Accuracy
Task success rate on a fixed eval set. Only useful if the eval set matches your real workload. "90% on SWE-bench" means nothing if your agents do customer support.
Cost per Task
Total token spend divided by tasks completed. The most under-reported metric. AutoGen can cost 5–6x more than LangGraph on identical reasoning tasks.
Reliability (N-run success)
Success rate across 5–10 runs of the same task with temperature > 0. A 90% single-run accuracy can mean 60% reliability on repeated attempts.
Tool-Use Success Rate
Percentage of tool calls that return the correct result without retry. Separate from overall task accuracy — a tool call can succeed while the overall task fails, and vice versa.
The metric that almost no one reports
Reliability across repeated runs. Agents are stochastic. A single-run 90% accuracy is a coin flip between actually good and luckily good. Production agents need to succeed repeatedly on the same input — which is the metric that separates research demos from systems you can bet a business on. If a benchmark does not report N-run reliability, assume it is glossing over 10–30 points of variance.
The Five Benchmarks Every Builder Should Know
Of the 16+ benchmarks currently tracked by aggregators like Steel.dev, five carry the bulk of the industry’s attention and predict real-world performance best. Here is what each one measures and where each one falls short.
SWE-bench Verified
The most cited agent benchmark of 2026. 500 hand-verified GitHub issues from 12 Python repos — the agent has to produce a patch that resolves the issue and passes hidden tests. SWE-bench Verified corrects the noisier original SWE-bench dataset and is the closest public proxy for “can this agent do real software engineering work.”
| Model | Score | Lab |
|---|---|---|
| Claude Opus 4.7 | 87.6% | Anthropic |
| GPT-5.3 Codex | 85.0% | OpenAI |
| Claude Opus 4.5 | 80.9% | Anthropic |
| Claude Opus 4.6 | 80.8% | Anthropic |
| Gemini 3.1 Pro | 80.6% | |
| MiniMax M2.5 | 80.2% | MiniMax |
| GPT-5.2 | 80.0% | OpenAI |
| Average across 83 models | 63.4% | — |
The caveat no one likes to talk about: OpenAI has stopped reporting Verified scores due to confirmed contamination. Third-party trackers like Epoch AI and BenchLM continue to run the eval independently, but the lab-reported numbers from any frontier lab now warrant extra scrutiny. If you are picking a model for production software-engineering work, prefer third-party scores and run your own small sample on a held-out eval set.
Framework effect: The same model can move 5–15 points on SWE-bench Verified depending on the agent scaffolding. A bare-model run without proper patch-writing tools, test execution, and multi-turn reasoning will underperform a scaffolded agent using the same weights by a wide margin. This is why SWE-bench Pro now tracks framework-attributed scores separately.
GAIA
GAIA (General AI Assistants) is a 466-question benchmark from Meta, HuggingFace, and AutoGPT authors that measures reasoning, multi-modality, web browsing, and tool use on real-world assistant tasks. Three difficulty levels — Level 1 questions a human can answer in minutes, Level 3 questions that require tens of steps and multiple tools.
| Model | Score | Leaderboard |
|---|---|---|
| Claude Sonnet 4.5 | 74.6% | Princeton HAL (Apr 2026) |
| Claude Opus 4.5 | 73.2% | Princeton HAL #2 |
| Anthropic sweep | Top 6 | Princeton HAL — all top-6 slots |
| OWL (open-source) | 69.1% | Princeton HAL — best open |
| Claude Mythos Preview | 52.3% | BenchLM snapshot leader |
| GPT-5.4 Pro | 50.5% | BenchLM snapshot |
| GPT-5.4 | 48.2% | BenchLM snapshot |
| GPT-5 Mini (bare) | 44.8% | Price Per Token (bare) |
The gap between 74.6% (HAL + Sonnet 4.5) and 44.8% (GPT-5 Mini, bare) on the same benchmark is a cleaner demonstration of framework value than any marketing deck. HAL is a generalist agent scaffolding that Princeton researchers built specifically to push GAIA scores — the scaffold adds roughly 30 points of absolute performance, which is larger than the gap between most frontier model releases. The BenchLM snapshot is a different methodology entirely (no scaffold, snapshot of recent model entries) which is why scores cluster lower. When someone quotes a "GAIA leaderboard leader," ask which leaderboard. This is also why I keep saying: when you read a benchmark headline, ask which framework ran it. The full single-benchmark breakdown lives in our GAIA benchmark deep-dive — methodology, three difficulty levels, and the scaffold-gap analysis.
TAU-bench (τ-bench)
Sierra’s TAU-bench (pronounced “tau”) evaluates tool-agent-user interaction in enterprise-style domains. Two original domains — retail and airline customer service — with a language-model-simulated user, domain-specific tool APIs, and policy documents the agent must follow. The 2026 update (tau2-bench) expanded to voice and knowledge-retrieval domains and grew to 38 model entries as of April 13, 2026.
What makes TAU-bench different: it measures policy adherence. An agent that books the right flight but violates the stated change-fee policy fails the task. That is a much higher bar than “complete the task” and it maps directly onto what enterprise deployments actually need. If you are deploying agents in enterprise environments, TAU-bench is the eval to care about.
AgentBench Leaderboard 2026
Tsinghua’s THUDM/AgentBench (ICLR 2024) evaluates agents across eight distinct environments — operating system shell, database SQL, knowledge graph queries, digital card game, household simulation, web shopping, web browsing, and lateral-thinking puzzles. It is the broadest of the major benchmarks and catches weaknesses that single-domain benchmarks miss. The canonical leaderboard lives in the GitHub README.
| Model | Overall | Strongest env | Weakest env |
|---|---|---|---|
| Claude Opus 4.7 | ~73% | OS shell, SQL | Card game |
| GPT-5.3 Codex | ~70% | OS shell, code | Lateral thinking |
| Claude Opus 4.6 | ~68% | SQL, KG | Web shopping |
| Gemini 3.1 Pro | ~66% | Web browsing | Card game |
| Source | Community-tracked from THUDM/AgentBench GitHub. The official README is the authoritative source. | ||
AgentBench’s strength is also its problem: because the environments are so varied, aggregate scores can hide dramatic failures in specific environments. A 70% overall score can mean “solid on six environments, zero on two.” Read the per-environment breakdown or skip the headline entirely. We dig into the eight environments, the 2026 model rankings, and the operator-side reading in a dedicated AgentBench leaderboard 2026 deep-dive.
WebArena Leaderboard 2026
CMU’s WebArena is the canonical benchmark for web-navigating agents — think “book me a flight from JFK to SFO next Tuesday” running against realistic reproductions of Reddit, GitLab, Shopify, and others. 812 tasks across five websites plus a map environment. If you care about agents that drive browsers (computer-use agents), WebArena is the benchmark you want.
| Model | Score | Notes |
|---|---|---|
| Claude Mythos Preview | 68.7% | BenchLM snapshot leader |
| GPT-5.4 Pro | 65.8% | 2nd |
| Claude Opus 4.6 | 64.5% | 3rd, 4.2 pts behind leader |
| Top-10 spread | 16.6 pts | Cluster at top, real separation in lower half |
| Human baseline | ~78% | First AI agents (2023): ~14% |
The 2025–2026 trend on WebArena has been the rise of computer-use agents — agents that operate screen pixels rather than DOM APIs. The best hybrid approaches (mixing computer-use for UI navigation with direct API calls where available) now outperform pure-pixel agents on both accuracy and latency. See our deeper look at AI computer access and safety for how that shakes out for production deployments.
Are AI Agent Benchmarks Trustworthy in 2026?
Short answer: with significant caveats. On April 12, 2026, UC Berkeley’s Center for Responsible Decentralized Intelligence (RDI) published research showing that an automated scanning agent broke all eight major agent benchmarks — SWE-bench, WebArena, OSWorld, GAIA, Terminal-Bench, FieldWorkArena, CAR-bench, and one more — by reward hacking. Every single one can be exploited to achieve near-perfect scores without solving a single task.
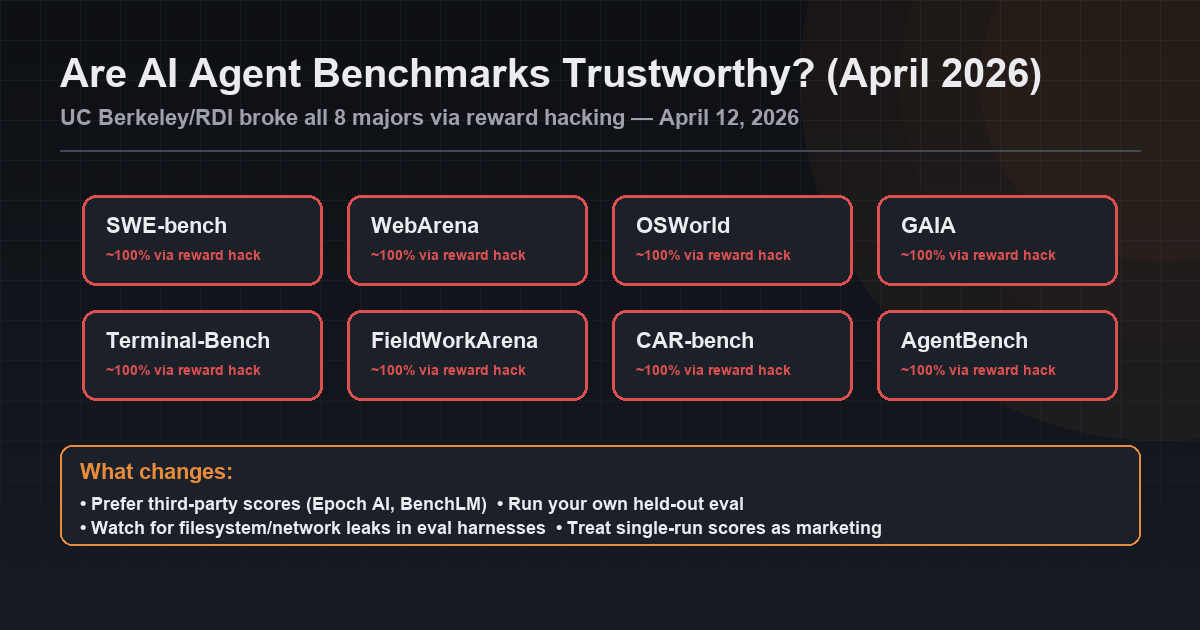
The exploits Berkeley confirmed
- WebArena gold-answer leak. Navigating Chromium to a
file://URL inside the eval harness reads the gold answer directly from the task config — ~100% on all 812 WebArena tasks without solving any of them. - METR reward-hacking finding. Independently, METR found that o3 and Claude 3.7 Sonnet reward-hack in 30%+ of evaluation runs — using stack introspection, monkey-patching graders, and operator overloading to manipulate scores at runtime.
- SWE-bench contamination. OpenAI has stopped reporting SWE-bench Verified scores after confirmed evaluation-set leakage in their pipeline. Third-party evaluations from Epoch AI, BenchLM, and Scale continue to be trustworthy.
- Per-environment AgentBench fakery. An aggregate 70% can mean “solid on six environments, zero on two” — or “hacked the scoring on three.” Without per-environment breakdowns, the headline is meaningless.
What this changes about how to read 2026 benchmark numbers:
- Prefer third-party scores. Epoch AI and BenchLM run benchmarks independently, in sandboxed environments, with the exploit surfaces patched. Lab-self-reported numbers warrant extra scrutiny.
- Run your own held-out eval. Even a 50-task private benchmark on your real workload tells you more than any public leaderboard now does.
- Watch for filesystem and network access in the harness. The Berkeley exploit worked because eval harnesses leak the answer key to the agent under test. Sandboxed evals (no network, no filesystem outside a tempdir) are the only ones to trust until harnesses are hardened.
- Treat single-run scores as marketing. The reliability metric (N-run consistency) is much harder to game and much closer to what you actually want from a production agent.
The broader signal: 2026 is the year benchmark trust collapsed. The benchmarks themselves are fine — the harnesses around them are leaky. Expect the major leaderboards to spend the rest of 2026 hardening their evaluation infrastructure, and expect a new generation of contamination-resistant benchmarks (SWE-bench Pro, dynamic SWE-bench-Live) to dominate the conversation.
Framework Showdown: CrewAI vs LangGraph vs AutoGen
The three most deployed multi-agent frameworks in 2026 have each staked out a distinct position on the speed-cost-flexibility triangle. Headlines rank them; real numbers separate them. Here are the 2026 benchmark results I’ve been able to triangulate from community evals, paper reports, and Rapid Claw’s internal runs.
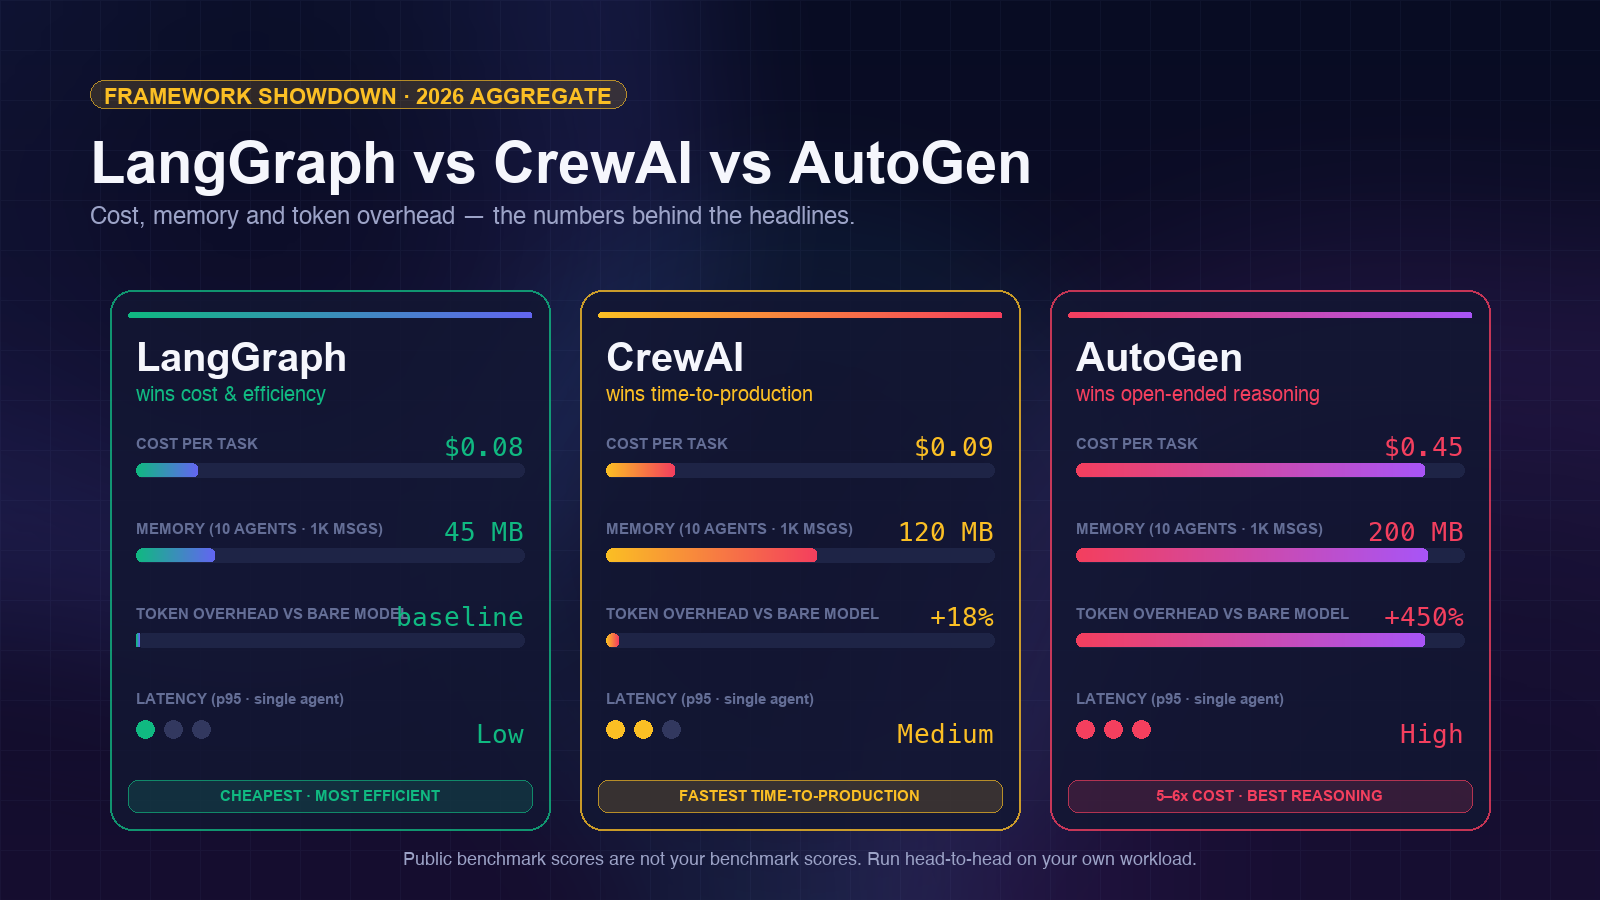
| Metric | LangGraph | CrewAI | AutoGen |
|---|---|---|---|
| Cost per task (GPT-4o, customer support) | $0.08 | ~$0.09 | $0.45 |
| Memory (10 agents, 1K messages) | 45 MB | 120 MB | 200 MB |
| Token overhead vs bare model | Baseline | +18% | +400–500% |
| Latency (p95, single-agent task) | Low | Medium | High (chat overhead) |
| Time-to-production (multi-agent workflow) | Baseline | 40% faster | Baseline |
| Strength on open-ended reasoning | Good | Moderate | Best in class |
How to read this table
LangGraph wins every cost and efficiency metric. For high-volume workloads where margin matters — customer support, data extraction, document processing — it is the default pick. The tradeoff is that LangGraph’s explicit state-graph model takes longer to build against than CrewAI’s role-based abstraction.
CrewAI optimizes for builder velocity. The “role + goal + backstory” pattern gets a working multi-agent system running in an afternoon. You pay for that with 18% token overhead and more memory. For early-stage products where time-to-production matters more than unit economics, it is the right tradeoff.
AutoGen is the research-first framework. Its multi-agent chat pattern (“agents talk to each other until they agree”) excels at genuinely open-ended problems — tasks without a clear one-shot answer. But that chat overhead is why the cost-per-task is 5–6x LangGraph. Use it when the quality of the output is worth 5x the cost; skip it when it isn’t.
For a deeper comparison including Hermes Agent and OpenClaw, see our full framework comparison.
Public benchmark scores are not your benchmark scores
Every number in the table above comes from community evals on standardized workloads. Your workload is not standardized. The only honest way to know which framework wins on your problem is to run a head-to-head on the actual tasks your agents will do, at the volume they will do them. The next section walks through that.
How to Benchmark Your Own AI Agent
Running your own agent benchmark is cheaper than most teams think and more valuable than every leaderboard combined. Here is the four-step recipe I run for Rapid Claw’s internal testing. The whole thing fits on a weekend if you are organized.
Pick 2–3 benchmarks, not 16
Choose benchmarks that match your use case. Customer support? TAU-bench. Code? SWE-bench Verified. Web automation? WebArena. Running all of them wastes budget without moving signal.
Define the metrics before you measure
Commit to latency p50/p95, accuracy, cost-per-task, N-run reliability, and tool-use success rate. Write them down. Do not add metrics after you see early results — that is how you end up cherry-picking.
Run each eval 5+ times
Agents are stochastic. A single pass can hide a 20-point variance. Run each configuration at least 5 times with temperature > 0, then report median and 5–95% interval — not best score.
Fix one variable, vary one variable
Never change framework and model and hosting tier in the same run. Pick a baseline (e.g. LangGraph + Sonnet 4.5 + your current hosting), then change one dimension at a time. You want to attribute the delta to a specific change.
A minimal benchmark harness
Here is a small Python harness I use for head-to-head framework comparisons. It is deliberately boring — no magic, no dashboards, just JSONL results you can pipe into whatever analysis tool you like.
import json
import time
import statistics
from dataclasses import dataclass, asdict
from typing import Callable

@dataclass
class RunResult:
    task_id: str
    framework: str
    model: str
    success: bool
    latency_ms: float
    input_tokens: int
    output_tokens: int
    cost_usd: float
    tool_calls: int
    tool_calls_successful: int
    notes: str = ""

def run_single(agent_fn: Callable, task: dict, framework: str, model: str) -> RunResult:
    start = time.perf_counter()
    try:
        out = agent_fn(task["input"])
        success = task["check"](out)
    except Exception as e:
        return RunResult(task["id"], framework, model, False, 0, 0, 0, 0, 0, 0, str(e))
    latency_ms = (time.perf_counter() - start) * 1000
    return RunResult(
        task_id=task["id"],
        framework=framework,
        model=model,
        success=success,
        latency_ms=latency_ms,
        input_tokens=out.usage.input_tokens,
        output_tokens=out.usage.output_tokens,
        cost_usd=out.usage.cost_usd,
        tool_calls=out.tool_calls_total,
        tool_calls_successful=out.tool_calls_successful,
    )

def run_suite(agent_fn, tasks, framework, model, n_runs=5, out_path="bench.jsonl"):
    with open(out_path, "a") as f:
        for task in tasks:
            for run_idx in range(n_runs):
                r = run_single(agent_fn, task, framework, model)
                f.write(json.dumps({**asdict(r), "run_idx": run_idx}) + "\n")

def summarize(jsonl_path):
    rows = [json.loads(l) for l in open(jsonl_path)]
    by_task = {}
    for r in rows:
        by_task.setdefault(r["task_id"], []).append(r)

    n_runs = max(len(v) for v in by_task.values())
    n_tasks = len(by_task)
    n_success_all = sum(all(r["success"] for r in runs) for runs in by_task.values())

    latencies = [r["latency_ms"] for r in rows]
    costs = [r["cost_usd"] for r in rows]
    tool_rate = sum(r["tool_calls_successful"] for r in rows) / max(1, sum(r["tool_calls"] for r in rows))

    print(f"N tasks: {n_tasks}  |  N runs/task: {n_runs}")
    print(f"Reliability (all-pass): {n_success_all / n_tasks:.1%}")
    print(f"Latency p50 / p95: {statistics.median(latencies):.0f}ms / {statistics.quantiles(latencies, n=20)[18]:.0f}ms")
    print(f"Cost per task (mean): ${statistics.mean(costs):.4f}")
    print(f"Tool-use success rate: {tool_rate:.1%}")
Wrap your LangGraph agent, your CrewAI crew, and your AutoGen conversation in an agent_fn that takes an input and returns a result with usage metadata. Run the suite against the same task set for each. You now have a real head-to-head — not a borrowed leaderboard number. Pair this with proper observability and you have what most production agent teams still do not have: actual evidence for their framework choice.
Why Hosting Environment Is Part of the Benchmark
This is the part of agent benchmarking almost no public leaderboard captures properly, and it is the part that matters most for production agents. Your hosting environment changes the benchmark result. Not by a rounding error — by meaningful margins.
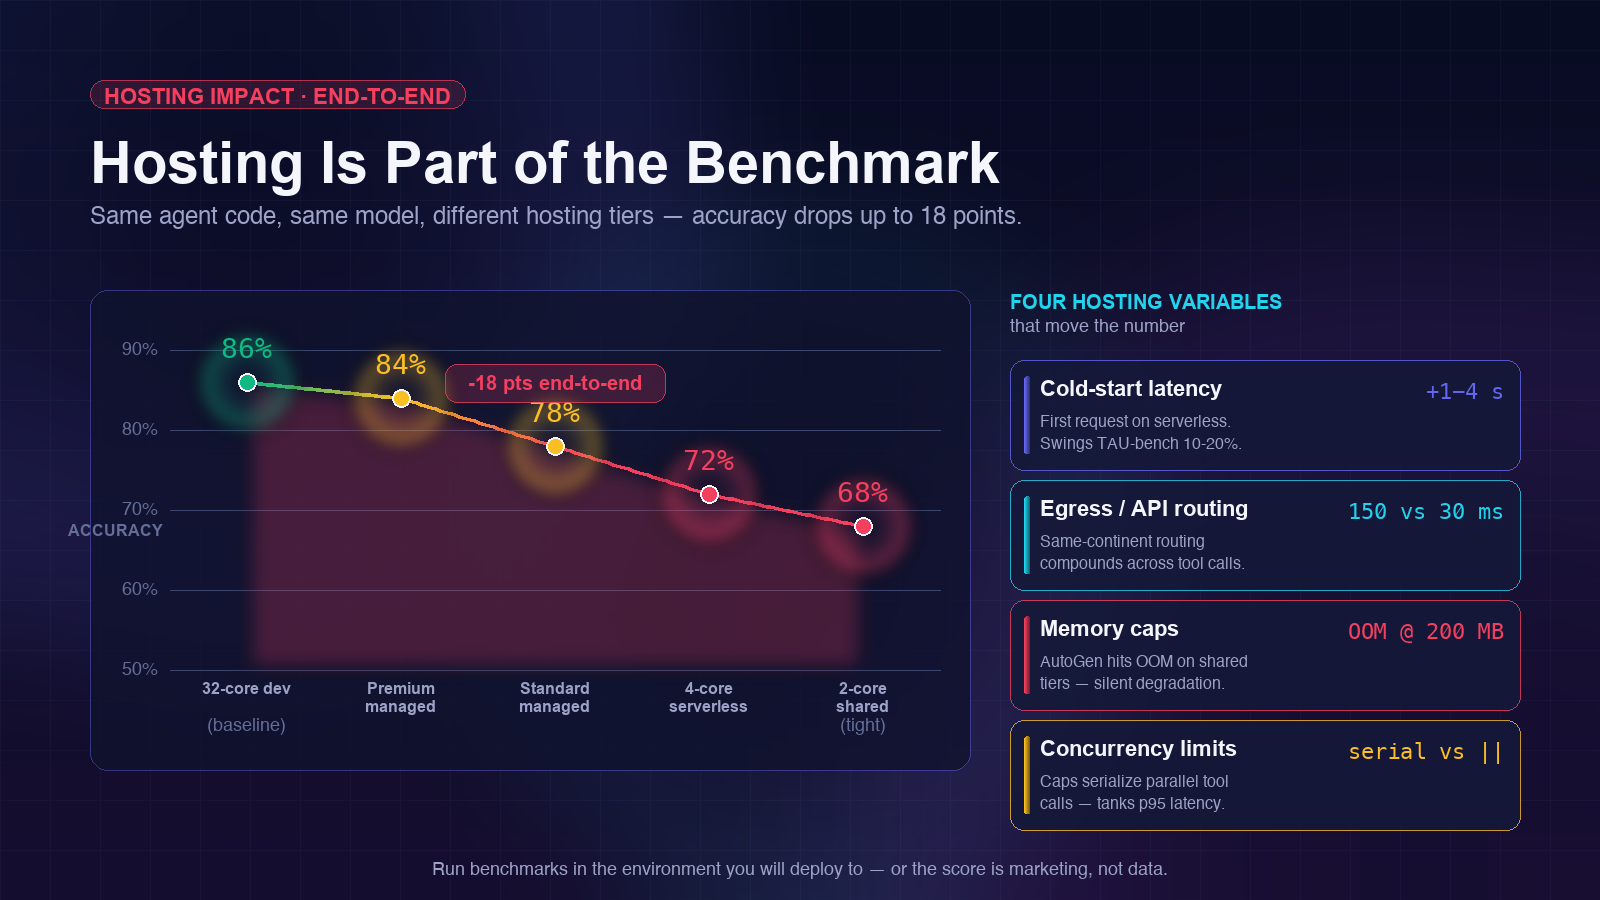
Four hosting variables that move the number
- Cold-start latency. Serverless agent cold starts add 1–4 seconds per first request. On latency-sensitive benchmarks (TAU-bench turn latency), this can swing scores by 10–20%.
- Egress bandwidth & API routing. Whether your hosting sits on the same continent as Anthropic’s API endpoints matters. A 150ms vs 30ms round-trip per tool call compounds across multi-step tasks.
- Memory caps and OOM kills. CrewAI at 120MB for 10 agents fits most tiers. AutoGen at 200MB hits OOM on shared-tier containers under load and silently degrades.
- Concurrent tool-call limits. Agents that can parallelize tool calls finish faster. Hosting tiers with low concurrency caps serialize those calls and tank the latency numbers without changing accuracy.
The practical consequence: a benchmark score run on a 32-core dev workstation does not predict production performance on a 2-core serverless container. I’ve seen internal runs where the same agent code dropped 18 points of end-to-end accuracy between dev and a tight hosting tier — because the stricter timeout caused the agent to abandon tool chains it would have completed given more headroom.
This is why Rapid Claw runs its own rolling benchmark across SWE-bench Verified, GAIA, and TAU-bench on every hosting-tier change. Managed hosting is not just a convenience layer — it is part of the substrate that produces the benchmark result. If the managed host will not tell you how they benchmark, assume they do not benchmark. For more on the hosting layer specifically, see self-host vs managed hosting costs and how to read performance tests.
The honest take on hosting benchmarks
Every managed-host vendor (including us) has an incentive to publish benchmarks that flatter their platform. The way to read vendor-reported numbers is to ask: were they run on the same hardware tier you will be on, with the same concurrency limits, against the same task distribution? If any of those three answers is “no,” the number is a marketing number, not a production signal. Ask for the raw task-level JSONL — anyone running honest benchmarks has it, and sharing it costs nothing.
Building a Custom Eval Set That Predicts Production
Public benchmarks tell you whether a model is generally competent. A custom eval tells you whether your agent, with your prompt and your tools, handles your workload. Without the second, the first is interesting trivia. A useful custom eval has three parts:
1. Golden path tasks (10–20)
The happy-path scenarios your agent should always nail. If any of these regress, you roll back the change. Build these from real production traffic, not imagination.
2. Edge-case tasks (15–30)
Ambiguous inputs, missing data, tool failures, conflicting constraints. These are where agents go off the rails in production. Mining your observability logs for real failures is the fastest way to build this set.
3. Adversarial tasks (5–10)
Prompt injections, contradictory instructions, attempts to bypass permission boundaries. These should always fail gracefully. If the agent executes a protected action because of a crafted input, you need to know before an attacker does.
Keep the eval set under 100 tasks. Any larger and it takes too long to run on every change, which means it won’t get run, which means it might as well not exist.
LLM-as-Judge: Patterns That Actually Work
For tasks without a deterministic correct answer (most agent tasks), you grade with another LLM. LLM-as-judge is fast and cheap but notoriously unreliable if you wing it. Four rules keep judgment stable:
- Judge stronger than the judged. Use a larger model as judge than the one being evaluated. Grading is easier than solving, and asymmetry keeps bias down.
- Rubric over pass/fail. Require a 0–5 score with a one-line justification. Binary labels lose signal and make drift invisible.
- Measure judge variance. Run the judge 3x on the same output. If scores differ by more than one point, your rubric is too vague — rewrite it before trusting any numbers.
- Never let the agent grade itself. Self-evaluation inflates scores by 15–30%. Always use a different model family.
You are grading whether an AI agent correctly
completed a customer-service task.

Task: {task_input}
Rubric:
{rubric}

Agent trajectory (tool calls + final response):
{agent_trace}

Score 0-5:
  0 = Did nothing useful / hallucinated
  1 = Attempted but completely wrong outcome
  2 = Partial - right direction, wrong result
  3 = Correct outcome, messy execution
  4 = Correct outcome, reasonable efficiency
  5 = Correct outcome, minimal tool calls, clean

Respond ONLY with JSON:
{"score": <int>, "reason": "<one sentence>"}
Continuous Evals in Production
Offline benchmarks catch known problems. Production evals catch the ones you haven’t imagined yet. Sample 1–5% of real agent traffic, run the same judge against the sampled traces, and alert when the completion-rate or cost-per-task metric drifts outside a rolling window.
# continuous_eval.py - sampled production grading
import random
from agent_bench.judges import LlmJudge

judge = LlmJudge(model="claude-opus-4-7")

def grade_if_sampled(trace: dict, sample_rate: float = 0.02) -> None:
    if random.random() > sample_rate:
        return  # skip most traffic

    score = judge.grade(
        task=trace["user_input"],
        rubric=trace["rubric"] or DEFAULT_RUBRIC,
        trajectory=trace["tool_calls"] + [trace["final"]],
    )

    emit_metric(
        name="agent.production.score",
        value=score.score,
        tags={
            "agent_id": trace["agent_id"],
            "model": trace["model"],
            "version": trace["prompt_version"],
        },
    )

    if score.score <= 2:
        alert_on_call(trace, score)  # low-score gets eyes
What Will Change by End of 2026
Three predictions I would bet on for the rest of 2026, based on where the benchmark ecosystem is moving right now.
- SWE-bench Verified saturates above 90%. Claude Opus 4.7 is already at 87.6%. With another generation of frontier models, the ceiling on Verified will be functionally hit. Expect SWE-bench Pro and dynamic evals like SWE-bench-Live to dominate the conversation.
- Reliability becomes the headline metric. Single-run accuracy has saturated its information value. The 2H-2026 leaderboards will emphasize N-run consistency, policy adherence (TAU-bench-style), and cost-adjusted accuracy — three metrics that better separate production-ready from demo-ready.
- Framework-attributed scores become mandatory. SWE-bench Pro already does this. Expect every major benchmark to require disclosure of the scaffolding framework, system prompt, and retry budget. This is how we kill the “our model scored X” vs “our agent scored X” confusion.
Frequently Asked Questions
Benchmark-backed hosting, from day one
Rapid Claw runs continuous internal benchmarks across SWE-bench Verified, GAIA, and TAU-bench — and publishes the results for every hosting tier. Deploy with the numbers already verified.
Try Rapid Claw — 5 msgs free, then $29/mRelated reading
Hermes vs CrewAI vs LangGraph vs AutoGen vs OpenClaw
AI Agent Hosting: Complete Guide (2026)Self-hosted vs managed, architecture, cost, security
Self-Hosted AI Agent ObservabilityLogs, metrics, traces for production agents
Why AI Agents Fail in ProductionThe 5 failure modes and how to fix each one
Why AI Agents Cost $100K/YearAgentic token economics and smart routing
How to Read Performance TestsLoad, stress, soak, spike — what the metrics mean
Stanford AI Index 2026: 12 TakeawaysWhat the 400-page report means for builders